Portland Flood Maps: FEMA 2020 Update
Climate change, winter storms, questionable levees — the average home shopper has many good reasons to consider Portland flood risk before they buy. Your buyers’ real estate agent is a great resource, and should have information on hand about what the flood risk is for a home that you’re interested in.
For those who prefer the DIY approach, Portland flood maps available online allow you to check the potential for flooding at any given address. The maps we use most often in our real estate office are the Portland Flood Hazard Map and the FEMA map:
Portland Flood Hazard Map
The City of Portland has an impressive collection of online maps that allow the average person to find out just about anything about a given location in Portland. At PortlandMaps.com/advanced, you’ll find the Flood Hazard map under the “Natural Hazards” category.
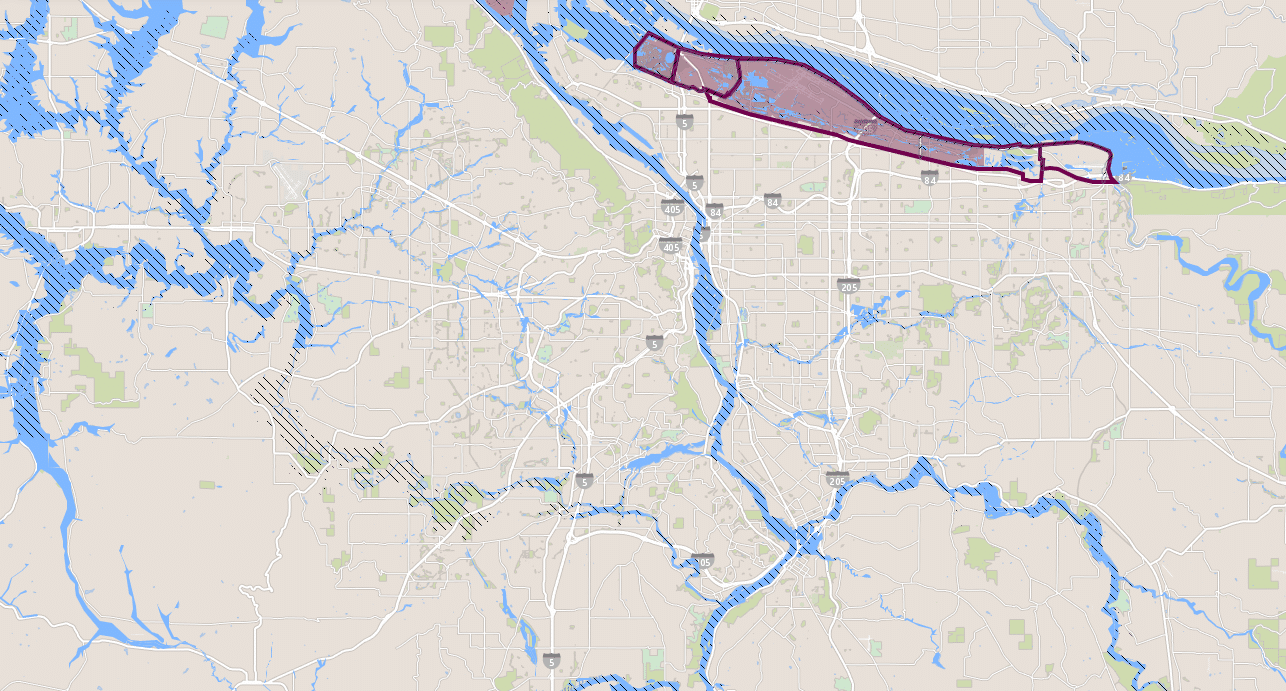
When you first enter the map, some purple- and blue-marked areas immediately jump out. So what do they mean?
These areas are layers in the map, and they are labeled under the “Layers” button (looks like a stack of white paper). Here’s what those layers represent:
- MCDD Levee layers. These first three layers show the levee review zone and risk areas for levees along the Columbia river (under the jurisdiction of Multnomah County Drainage District). A recent federal study found that the existing levee may be inadequate to contain the water that could be released in a major flooding event. The purple-shaded area toggled by clicking the layer titled “Reduced Flood Risk Due to Levee” shows the areas of Portland that are at risk from a potential levee failure.
- 1996 Flood Area. This layer shows how far the water came up in Portland’s last major flood, which happened in 1996. In this flood, heavy rain and snow caused all waterways in the area to rise. The Willamette crested at 28.6 feet in downtown, nearly 11 feet above what is normally considered the flood stage.
- FEMA Special Flood Hazard Area (100-year flood zone). Marked in blue, this layer shows the area with a 1% chance of flooding in any given year, with water of a depth to 1-3 inches. FEMA estimates that there’s a 26% chance that a flood will occur in these zones over the course of a 30-year mortgage. But homes outside the zone aren’t in the clear: The City of Portland reports that 20% of flood insurance claims are for areas outside the 100-year flood zone. So flood insurance is probably a good idea no matter where you live in Portland (and most homeowners insurance policies don’t cover floods or sewer backups, which can happen when stormwater water fills the city’s drainage system).
Portland FEMA Flood Hazard Maps
For those wanting to do more in-depth research before purchasing a piece of Portland real estate, FEMA also has an online system that produces localized maps with detailed flood risk layers. These maps are not as straightforward to read, but generally, lighter areas indicate less flood risk, while darker areas indicate that the flood risk is higher.
The good news is that searching the site and generating a flood map is simple. Simply enter the address you’re curious about in the search bar. Or, enter “Portland, Oregon” for an overview of the area.