Portland Real Estate Market – Final Update 2020

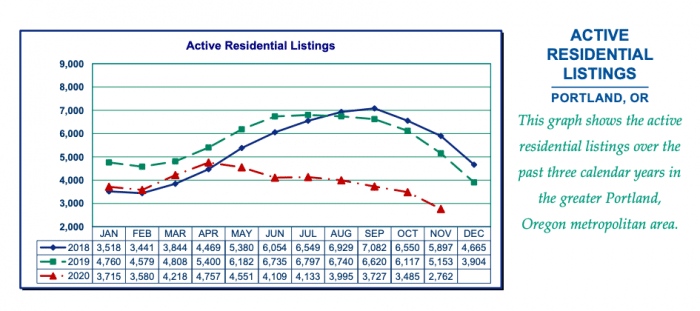
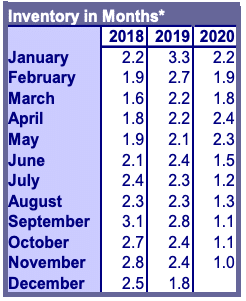
2020 was a record-setting year in the Portland real estate market. Every month, the Regional Multiple Listing Service, or RMLS, publishes detailed statistics on the local real estate market, including how many homes sold in the Portland metro area and for how much (average and median price). The most recent update shows that inventory hit a record low, 1.0 months in November. Mortgage rates also hit a record low in mid-November, bringing more buyers to the market.
Ever-rising home prices may inspire more home owners to become sellers in the coming weeks, loosening the tight inventory situation we currently find ourselves in. Between November 2019 and November 2020, the average sale price for a Portland-area home rose 7.1%. The current median sale price grew 6.8%, now at $438,000.
In addition to potentially earning $28,000 more for their home than they would have at the same time last year, sellers can also enjoy a very speedy sales process. Last year at this time, homes spent an average of 60 days on the market. This November, homes sold in just 41 days on average.
Here are some more highlights from the November RMLS report:
- The issue may be more with the demand for homes than with the supply. Although the number of new listings (3,515) coming on the Portland market in November fell compared to October 2020 (2,238 new listings), that’s typical for this time of year. In fact, there were close to 6% more new listings this November than there were in November 2019.
- Closed and pending sales followed a similar trajectory: There were 2,557 in November 2020, up 12% from the same month last year. But that’s still a 20% drop from October 2020. For closed sales, there were 2,745 in November, up 25.3% from November 2019 but down 13% from October of this year.
- Homes sold fastest this November in Tigard/Wilsonville, where they went from listed to sold in just 22 days on average.
- The area with the biggest average change in sales price was Lake Oswego/West Linn, where home prices have risen 10.9% in this 12-month period.
- The slowest-growing area was NE Portland, where average sales price went up “just” 5.0% in this 12-month period. As is typical for this region, we didn’t see any areas where home prices went down.

What’s driving Portland’s low inventory?
As we stated above, the biggest news to come out of this most recent RMLS report is that inventory is at just 1.0 months. In a time of year when buyer traffic usually slows down, we’ve never seen inventory get this low for November in Portland – not once. So what’s up?
It goes without saying that it’s been a weird year. Buyers were delayed from entering the market in spring, and we’re still seeing that pent-up demand play out. More people may be moving because of a change of job situation – working from home or just spending more time at home with the kids. And of course there are still historically low mortgage rates to take advantage of.
On the sellers’ side of things, according to a recent Oregon Live report, concern over not finding another home is keeping sellers from listing their current home. This fear unfortunately only adds to the low inventory problem.
Buyers want to buy, many deciding they need a different living situation to ride out the pandemic, but many sellers simply are not willing to go through the process of selling on the real estate market right now.
When a massive outside force (like a Pandemic) affects the Portland real estate market, it is especially hard to predict the future since it is largely dependent on the changes happening with the Pandemic itself and not simply market numbers. However, stay tuned. Our final Portland real estate market forecast is published the first part of Jan. every year.
Whether you’re buying or selling, our top 1% agents in Oregon and Washington are here and ready to serve.


