Top 5 Portland, Oregon Earthquake Maps
Yes, there is a certain amount of earthquake risk in Portland. Still, the good news is that geologists are getting better and better at understanding, mapping, and even predicting seismic activity. Maps can also help us be better prepared for disasters by showing resources and hazards. Take a look at these Portland maps before you buy a home. Be sure to click the header links to go to the earthquake maps.
Top Portland, Oregon Earthquake Maps
1. Latest U.S. Earthquakes Map
For those fascinated by seismic activity, this live US Geological Survey map provides up-to-the-minute information about earthquakes around the globe. Earthquakes appear as dots on the map; the colors indicate how long ago they happened. The map can show a history of all earthquakes for the past thirty days. Beyond that, there would be too much data for most home computers to display! It’s a good reminder that earthquakes are happening all the time around the world. In fact, Portland lies just at the edge of the Pacific rim, a very lively earthquake zone.
2. U.S. Quaternary Faults Map
This map shows where earthquakes are likely to occur around the world. California appears to be one solid fault line from a distance, but Oregon has a few, too. Zoom in on Portland to see the fault line running from Lake Oswego to Northwest Portland! Quaternary Faults appeared less than 1.6 million years ago—recently, in geologic time. And yes, while that Portland fault is technically an active one, geologic time offers some comfort here: an active fault is one that has had movement in the past 10,000 years.
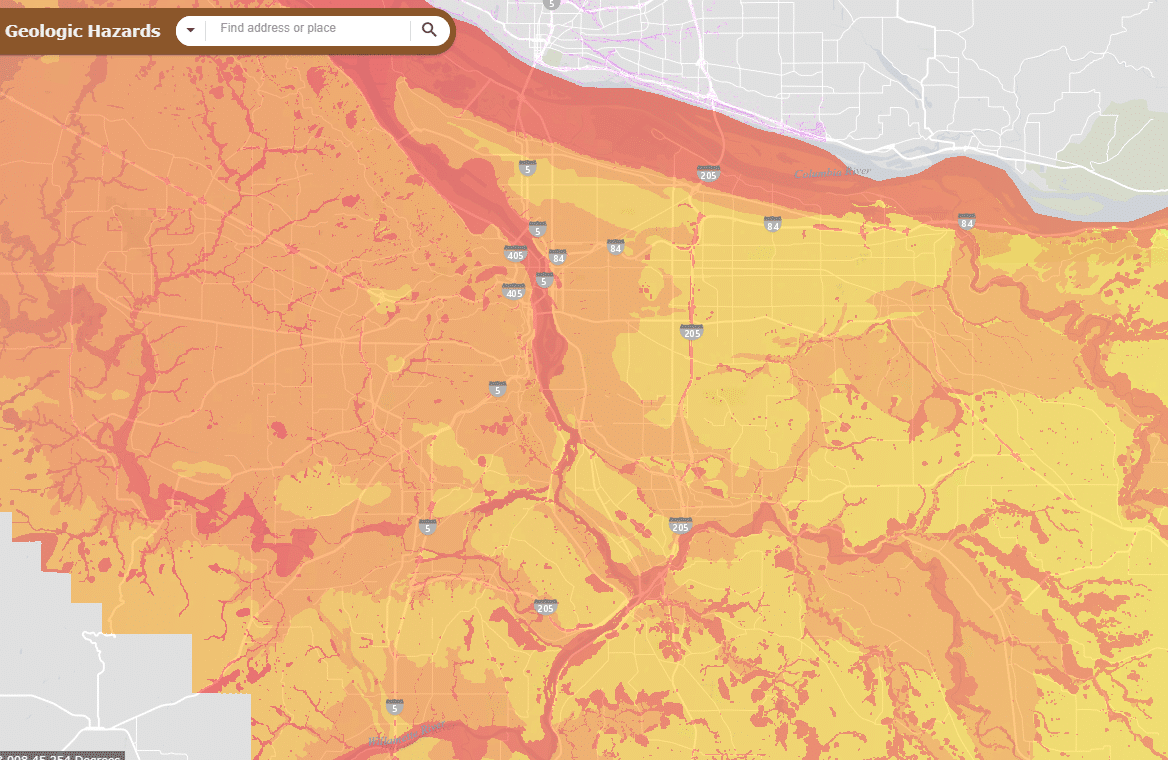
3. Portland Geologic Hazards Map
The latest earthquakes and faults maps are interesting, but they don’t actually show the hazard for an earthquake occurring in any given area. According to USGS, “Earthquake hazard is anything associated with an earthquake that may affect the normal activities of people. This includes surface faulting, ground shaking, landslide, liquefaction, tectonic deformation, tsunamis, and seiches [a type of standing wave that occurs in closed bodies of water].”
To learn about earthquakes that can (and will eventually) happen in Portland and other geologic hazards like landslides, our real estate agents turn to the Portland Geologic Hazards Map, created by the city’s Bureau of Planning and Sustainability. This map shows two major types of information:
- The intensity of the two earthquakes most likely to hit Portland in the near future. Using the Layers panel, users can toggle between a Cascadia Subduction Zone earthquake, or a Portland Hills Fault earthquake. The orange-red shading on the map indicates the intensity of shaking; most of Portland would experience very strong to severe effects if either one of these earthquakes were to happen!
- Landslide deposits and steep slopes. Hint: It’s easier to see these areas if you uncheck the “Earthquake Hazards” box in the Layers panel. The irregularly shaped areas filled with triangles are zones where landslides have happened, leaving behind deposits. Landslides are more likely in the event of an earthquake or heavy rainstorm, but they can occur anytime and are extremely destructive to property. Be sure you consult with a geoengineer before buying a home in an area affected by landslides!
4. Portland Unreinforced Masonry Buildings Map
This is another map by the Bureau of Planning and Sustainability. It shows all the buildings in Portland that could be dangerous when the ground starts shaking. Unreinforced Masonry Buildings, or URMs, are made of bricks or cinderblocks held together by mortar, which crumbles easily under seismic stress. Newer masonry buildings in Portland are reinforced by steel and bolted to their foundations; those built before 1960 were not. According to the City of Portland, “URMs are more prone to sustain significant damage, which may include partial or total collapse, during seismic events.” Knowing where URMs are in the city of Portland is important for residents and visitors alike—they are not places where you want to be when an earthquake hits!
This map has two layers: Colored squares showing URMs and color shades showing the earthquake hazard beneath those buildings. The Legend shows what the colors mean, with the earthquake hazard displayed as “low” to “very high” liquefaction.
But what is “liquefaction?” Good question. When soil or sand is saturated by water and subject to the kind of shaking that happens in an earthquake, it starts acting like a fluid. Think of when you stand on the beach in wet sand and wiggle your feet. That’s not an easy substance for a building to stand on, especially when the walls are not reinforced.
Fortunately, most homes in Portland are not built from unreinforced masonry; in fact, most Portland homes are made from wood, which is very earthquake-resistant. Still, many of those homes were built before seismic standards were put in place (in 1993) and could slide off their foundations in the event of an earthquake. The good news is that homes can be retrofitted to be more resilient to earthquakes. Read more here on our blog.
5. Pacific Northwest Seismic Network
Operated by the University of Oregon and the University of Washington, the Pacific Northwest Seismic Network (PNSN) tracks recent earthquakes in the Pacific Northwest. This map gets its funding from several sources, including the U.S. Geological Survey (USGS), the U.S. Department of Energy, the State of Washington, and the State of Oregon. This incredible service started out as only five seismometers in 1969, and now boasts over 300 stations, making it the second-largest seismographic station in the United States. Talk about a knowledge powerhouse!
Their website is surprisingly easy to navigate. On the homepage, you’ll see an active list of the most recent earthquakes in the area, their magnitude, and their distance from population centers. Clicking on the main map takes you to an interactive map of the most recent earthquakes, so you can easily track and learn more about any tremors you feel. While not isolated to Portland, this map can easily be zoomed in to the Portland area to tell you more about recent earthquake activity.
The one downside of this map is that it doesn’t show you earthquakes father back than two weeks from the current date, making it hard to judge how earthquake-prone different Portland areas are. However, if you’re looking for up-to-date information on the most recent earthquakes in the Portland area, or are wondering the size of an earthquake you felt in your Portland home, this resource is indispensable.
Runner-up. The Oregonian Earthquake Map
Another living earthquake map, The Oregonian gathers information from the United States Geological Survey. With information as far back as a month ago, you can use this data to determine if your ideal Portland home is in the range of frequent earthquakes. One helpful thing about this map is that the dots are color-coded, allowing you to easily distinguish between earthquakes that happened in the last 72 hours versus those that happened further back in time.
However, there is no easy way to organize these earthquakes by magnitude, and the map does show the entire United States, so it can take some zooming to find Portland. Still, if you’re looking for an up-to-date, easy-to-read map of the most recent earthquakes in the Portland area, this map is a useful resource to have on hand. Plus, with a thirty-day history, you can get a better idea of earthquake frequency for any given area, which can be helpful when planning for frequent earthquakes.
Custom. Your Own Neighborhood Earthquake Map
There’s yet another type of earthquake map out there, but this one doesn’t rely on geological information. We’re talking about a DIY map that shows vital information about resources and risks at the neighborhood level. The Map Your Neighborhood program is a grassroots effort to help Portland be more prepared for disaster.
Neighborhood Emergency Teams (NETs) are usually the people who create these maps, and they aren’t published online for privacy reasons. Portland’s NETs are made of volunteers who have gone through a training program designed by FEMA. They meet regularly and participate in simulations to be prepared for disasters like earthquakes.
Map Your Neighborhood is a way to identify things that need to be found quickly in case of an earthquake, such as gas shut-off valves or special hazards like URMs. These maps also show which neighbors have special needs and might not be able to help themselves in an emergency.
Does your neighborhood, or the neighborhood in which you’re considering buying a home, participate in Map Your Neighborhood? Find out by looking up your Neighborhood Emergency Team leader. Not only is emergency preparedness a great idea, it’s also an easy way to meet the neighbors.
Bonus. PortlandHomesForSale.com
While not a earthquake map in any respect, our preferred Portland home search websites includes topography on the main map. This helps home buyers easily see before scheduling a tour whether the home is sitting on the side of a hill or located at the bottom of a potential flood.
Work with a Local Expert
While Portland does suffer from the occasional earthquake, the vast majority of homes in Portland are safe, secure, and ready for new owners. Our team has over 20 years of experience selling in the area and we know the local geological hot zones, what to look for if you’re interested in buying a home in the hills or near a flood plain. If you’re looking for a home in the Portland, Oregon real estate market, contact one of our top 1% buyer’s agents, or to sell a home our top 1% sellers agents can help you as well.